Debugging Node.js apps in TypeScript with Visual Studio Code
When developing, there’s three things that I absolutely enjoy:
- Creating Node.js apps
- Working with TypeScript
- Debugging said apps in Visual Studio Code
I never combined all three of them. I developed Node apps and used the great debugging possibilities with VS Code. Or I wrote my Node.js apps in TypeScript using tsc or ts-node. But together, nope!
That’s where the magic is supposed to be, isn’t it? So I decided to get started with the complete setup. Since it took me a while and it requires some steps, I thought I better share that with you.
I’m using Node 9.8, VS Code 1.21 and TypeScript 2.7. Things might be different if you are using other versions.
Let’s go!
Setting up TypeScript #
I tried to make ts-node work for this setup, and made good progress. But at some point I was stuck and didn’t manage to debug my whole application. So I switched to a mode where I compile TypeScript first, then run debugging on the generated JavaScript files with source maps.
My TypeScript configuration tsconfig.json is pretty standard. I use a pretty late ES target (having Node an all), and I use commonjs as module format to work nicely with Node.js. The folder structure is easy: I have my TypeScript files in src, my output in bin.
{
  "compilerOptions": {
    "target": "es2017",
    "module": "commonjs",
    "allowJs": true,
    "checkJs": true,
    "outDir": "./bin",
    "sourceMap": true,
    "strict": true,
    "noImplicitAny": true,
    "strictNullChecks": true
  },
  "include": [
    "src/**/*.ts"
  ],
  "exclude": [
    "node_modules"
  ]
}
There are two important settings that need to be made. First we activate source maps, otherwise VSCode wouldn’t know how to map the generated output to your sources.
Second, I set "esModuleInterop" to true. TypeScript will transform import statements to require statements. We don’t need to work with native import statements on Node anyway.
TypeScript is set up! Once you run tsc in the terminal, you can see the output: generated JavaScript files and source maps along with it.
VSCode task config #
Now that TypeScript is set up, let’s do the same with VSCode. To make debugging work and pleasant, we want to set up an automated build task that runs before debugging. So every time we hit the debug button, we compile our updated TypeScript sources into JavaScript.
VSCode is pretty clever, as based on your file structure it automatically finds possible commands to run. Hit ⌘ + ⇧ + B on Mac or Ctrl + Shift + B on Windows to see possible build tasks.
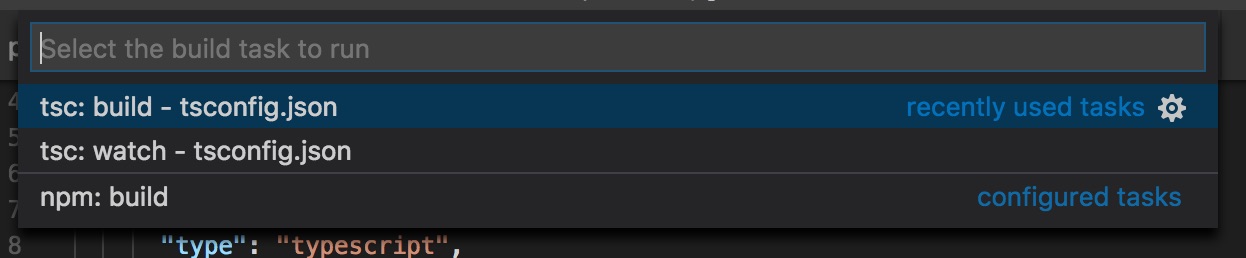
You can run them by selecting them. If you hit the wheel icon next to it, VSCode creates a tasks.json in the .vscode project folder, with all the setup you need. See below:
{
  "version": "2.0.0",
  "tasks": [
    {
      "type": "typescript",
      "tsconfig": "tsconfig.json",
      "problemMatcher": [
        "$tsc"
      ]
    }
  ]
}
Alright! Build task is set up! Let’s debug.
VSCode debug config #
The last thing we have to set up is the debug configuration in the launch.json file. You can generate this JSON file by clicking on the debug tab, and selecting “Add configuration” from the dropdown.
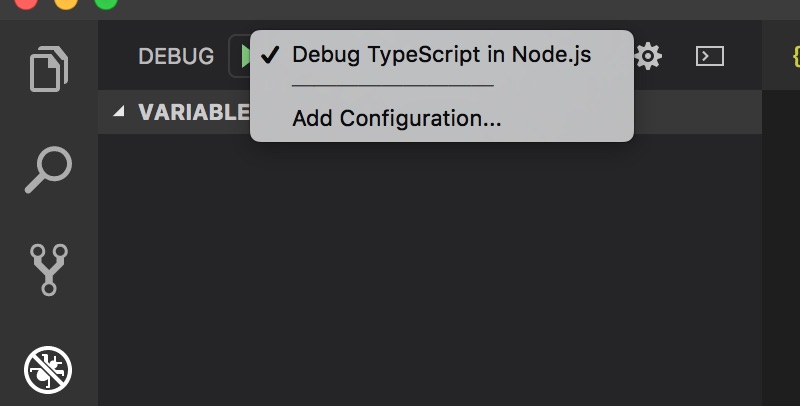
Select “Node.js: Launch Program” and you get a couple of fields pre-filled. The others, the more important ones, we have to set ourselves:
"preLaunchTask": "typescript". This is the task we defined one step earlier. Use the identifier you specified there."program": "${workspaceFolder}/src/index.ts". The program to launch. This is your application’s entry point. In that case the index TypeScript file."cwd": "${workspaceFolder}". Where to execute this program. I usually select the workspace folder."protocol": "inspector". The protocol to communicate between app and debugger. For Node versions greater than 6, useinspector."outFiles": [ "${workspaceFolder}/bin/**/*.js"]. An array to the generated output files and source maps. This is what the debugger is actually executing.
The whole file looks like this:
{
  "version": "0.2.0",
  "configurations": [
    {
      "type": "node",
      "request": "launch",
      "name": "Debug TypeScript in Node.js",
      "preLaunchTask": "typescript",
      "program": "${workspaceFolder}/src/index.ts",
      "cwd": "${workspaceFolder}",
      "protocol": "inspector",
      "outFiles": [
        "${workspaceFolder}/bin/**/*.js"
      ]
    }
  ]
}
And with that, you are all set up. Press the ▶️ button the debug view. You see your compile task executing, and once it’s finished you are right in the debug session.
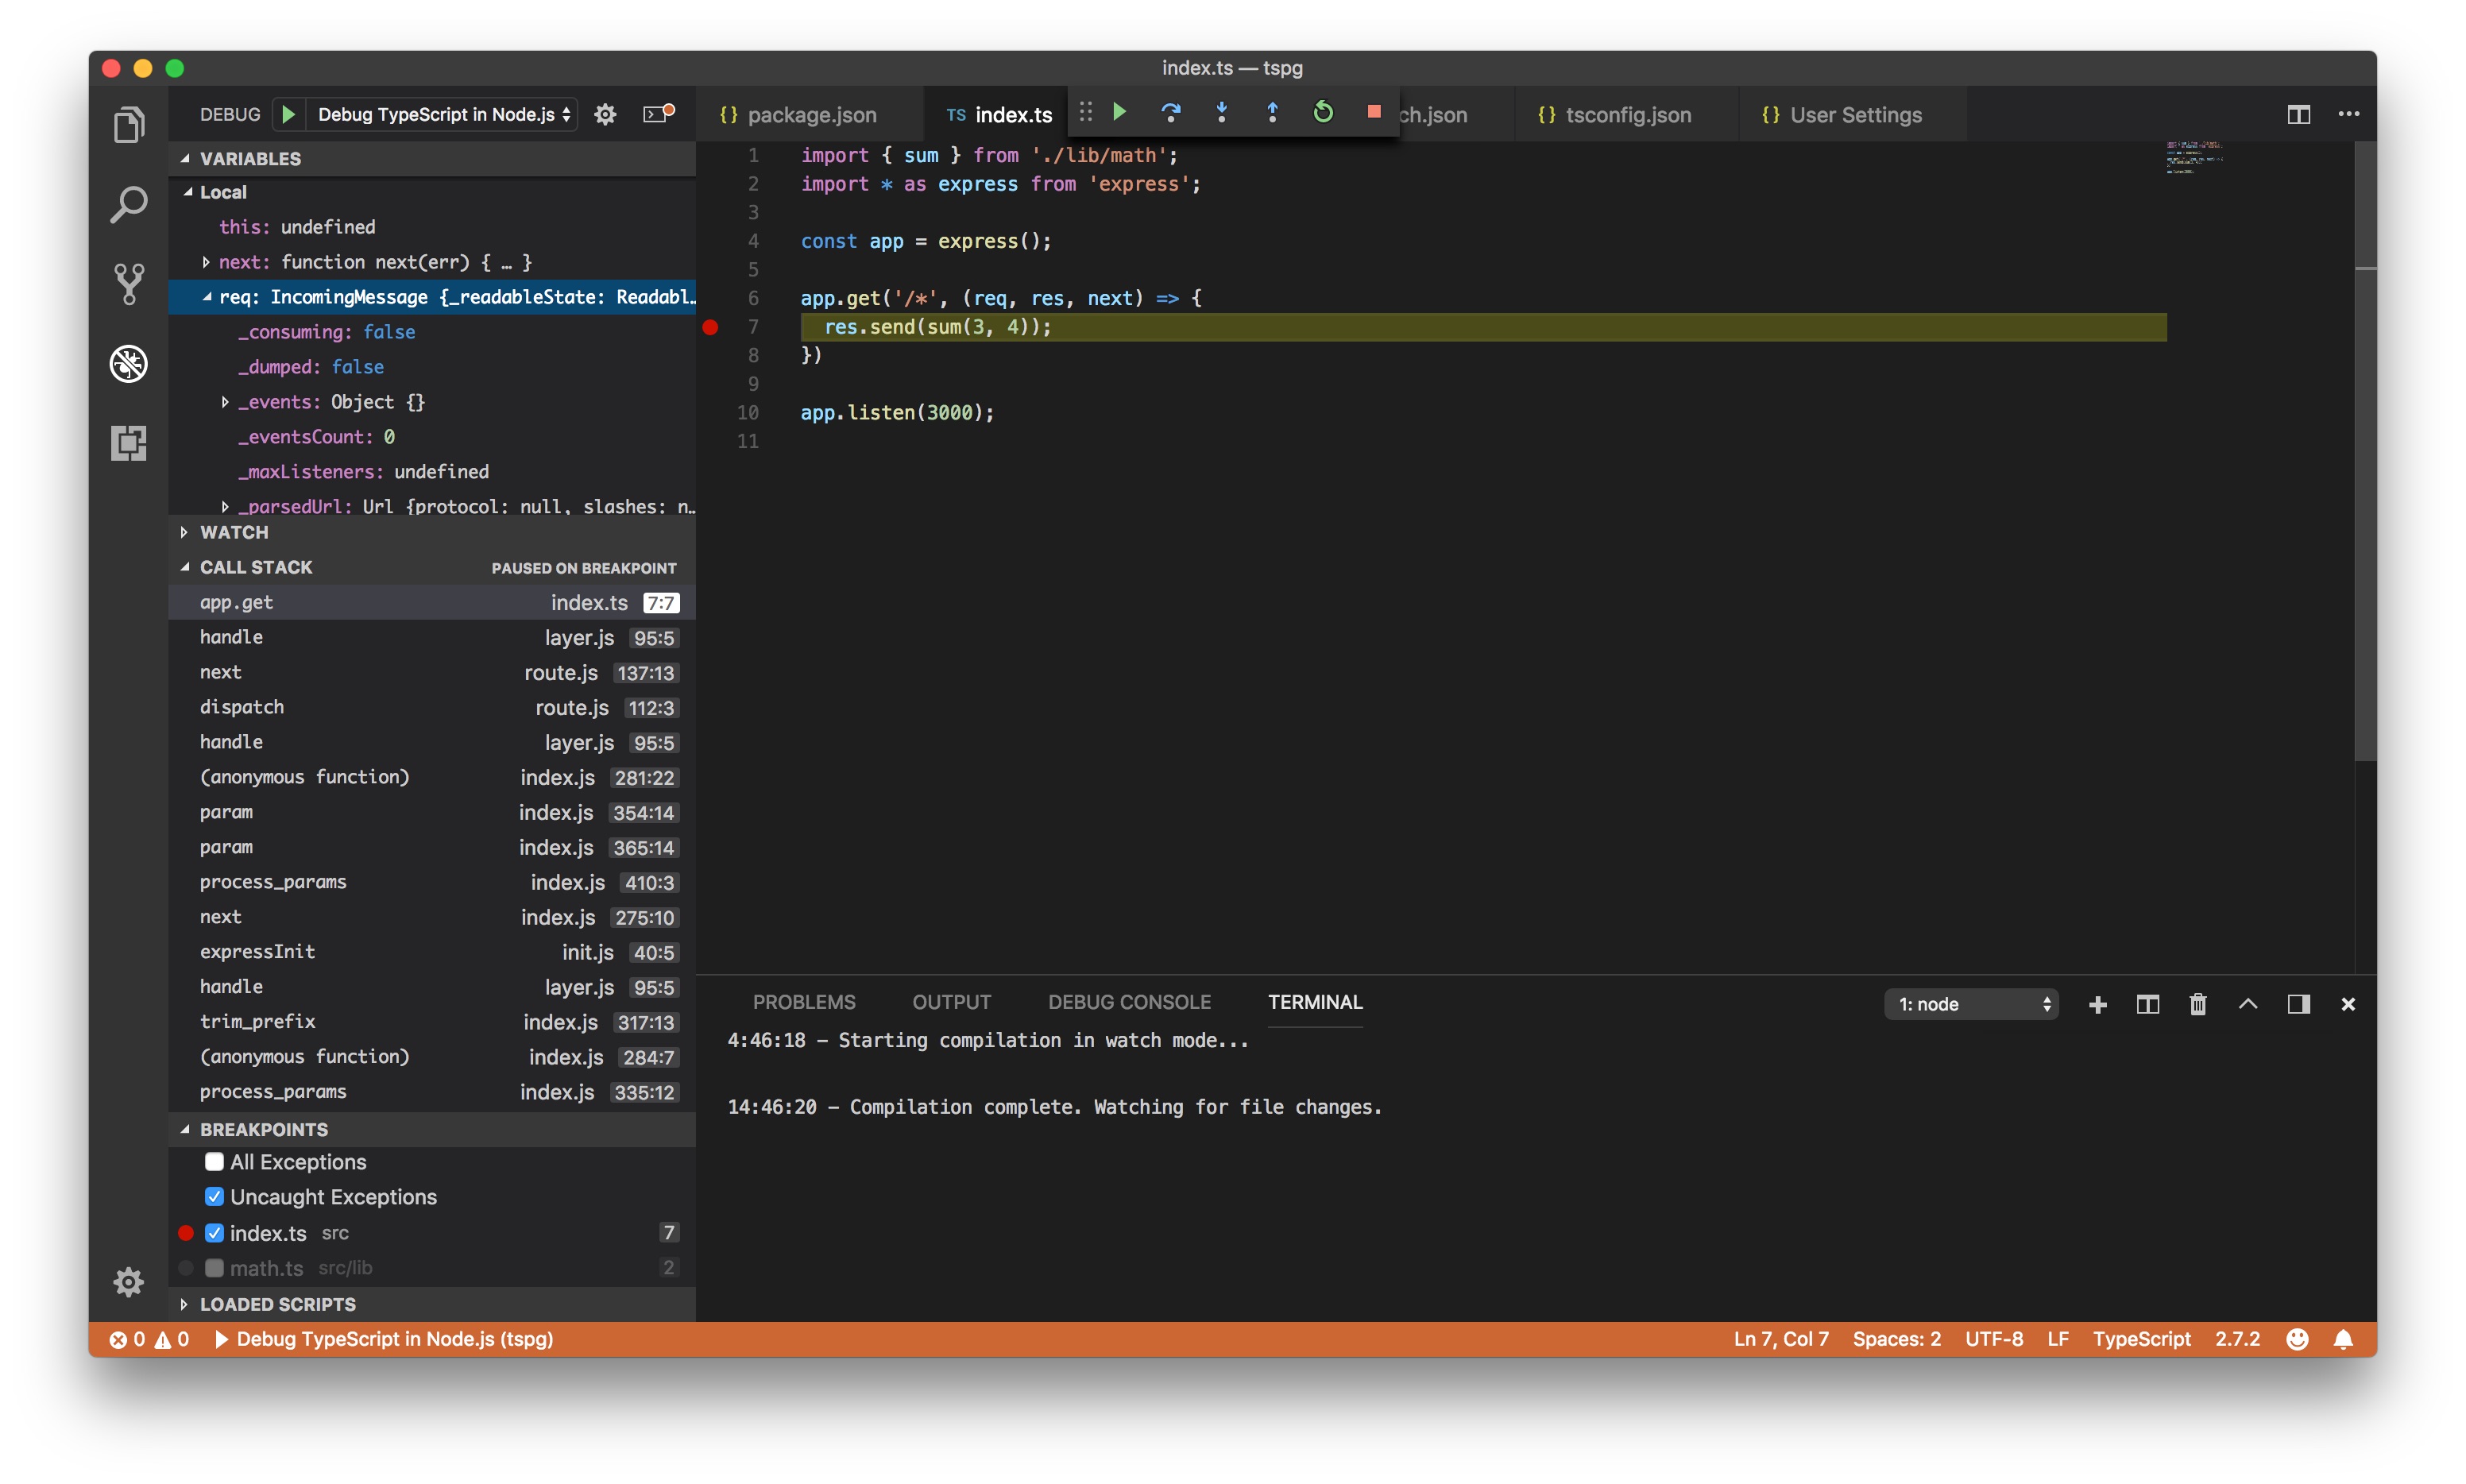
Try setting a breakpoint somewhere and have fun with all the details!